Running IntelliJ Inspections From Continuous Integration
Running IntelliJ Inspections From Continuous Integration
IntelliJ IDEA offers functionality to help improve our coding, within the IDE when writing code as Intentions. Intentions can be used in batch to inspect code for patterns throughout the source and even extending to Command-Line analysis or added to Continuous Integration. This post covers the out of the box IntelliJ functionality and expanding with custom Intentions created in Sensei.
IntelliJ Inspections
The Inspections feature of IntelliJ drives the display of many of the errors that are reported dynamically in the IDE when coding e.g.
- detecting abstract classes that can be converted to interfaces,
- identifying redundant class fields which can be local,
- warning about uses of deprecated methods,
- etc.
These Inspections highlight code that matches in the IDE as Intention Actions which often have an associated QuickFix.

The real-time IDE highlighting when code matches an Inspection can help us improve our coding dynamically. After identifying the issue in the code, using IntelliJ Intention Actions to QuickFix the code can reinforce better patterns.
Inspections Profile
Inspections can run as a batch from within the IDE, and from the Command Line or in a Continuous Integration process.
The key to working with IntelliJ inspections as a batch is through the use of an Inspections Profile.
IntelliJ has two default Inspection Profiles: one stored in the Project, and one stored in the IDE.
New Inspection Profiles can be created to configure specific plugins or use-cases e.g.
- Run Checkstyle real-time scan only
- Run a specific set of Sensei rules
- Run the HTML checks
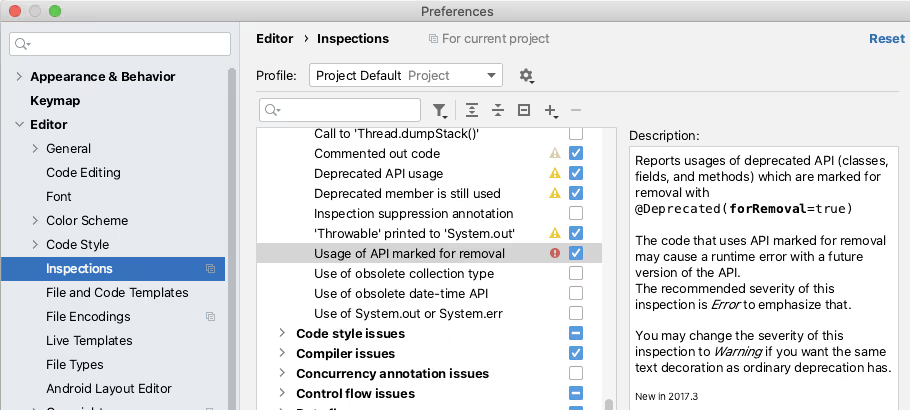
The Inspections in a profile can be enabled or disabled from the IntelliJ Preferences. The Preferences dialog is also an easy way to learn the range of Inspections available.
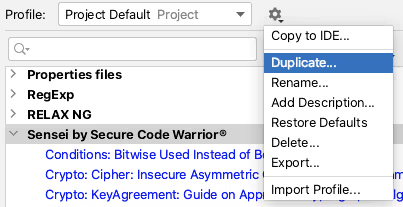
The ‘tool’ icon allows you to duplicate a Profile and create a new Profile to collect a specific set of rules.
Running an Inspection Profile in the IDE
Inspection Profiles can be run from within the IDE using the `Analyze \ Inspect Code...` menu.

The Analyze functionality allows you to control the scope that the Inspection will run against e.g. the whole project, including or excluding test sources, or against a specific set of files.
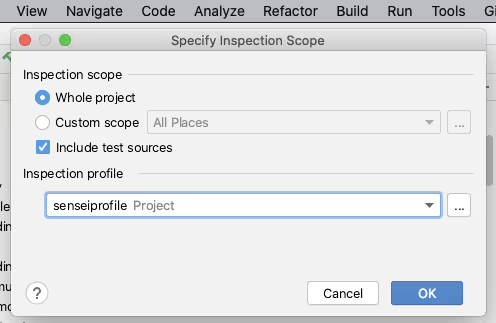
You can also manage the Inspection Profiles from here to create or configure a particular profile.
Clicking [OK] on the “Specify Inspection Scope” dialog will trigger IntelliJ into running all the selected Inspections in the profile across the defined scope.
IntelliJ will report the results of running the Inspections in the `Inspection Results` tab.

The Sensei plugin from Secure Code Warrior allows you to create custom code matching recipes. Sensei tightly integrates with IntelliJ to make these custom recipes as natural to use as the IntelliJ Intention Actions. Meaning they are loaded into IntelliJ as Inspections and can be grouped, enabled, and disabled using Inspection Profiles. Creating a custom Inspection Profile and then using the Analyze Inspect Code functionality is the recommended way of running Sensei recipes in bulk across a project.
Running an Inspection Profile from the Command Line
IntelliJ has the ability to run inspections from the command line as documented by JetBrains:
- https://www.jetbrains.com/help/idea/working-with-the-ide-features-from-command-line.html
I primarily use macOS, and can run a single instance of IntelliJ from the command line with:
open -na "IntelliJ IDEA CE.app"
To support easier execution I add this to a shell command script.
vi /usr/local/bin/idea
The contents of the script are from the official documentation provided by IntelliJ.
#!/bin/sh
open -na "IntelliJ IDEA CE.app" --args "$@"
I then made this executable to allow me to simplify the command line inspection process.
chmod 755 /usr/local/bin/idea
The official intellij docs describe the general form of the inspection command as:
idea inspect <project> <inspection-profile> <output></output></inspection-profile></project>
[<options>]</options>
In practice, I fully qualify the paths and don’t need any options:
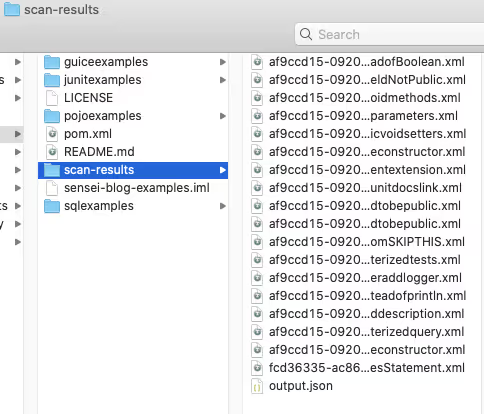
idea inspect /Users/user/GitHub/sensei-blog-examples /Users/user/GitHub/sensei-blog-examples/.idea/inspectionProfiles/senseiprofile.xml /Users/user/GitHub/sensei-blog-examples/scan-results
This runs all the Inspections I added to the `senseiprofile` and reports the results in the `scan-results` folder.
Viewing Inspection Results
We can report these results from within Continuous Integration, as we’ll see later.
We can also view them within IntelliJ itself using the `Analyse \ View Offline Inspection Results…` feature.
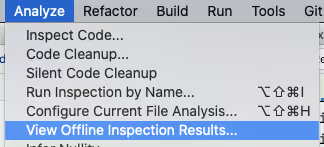
This will load the results into the `Inspection Results` tab.
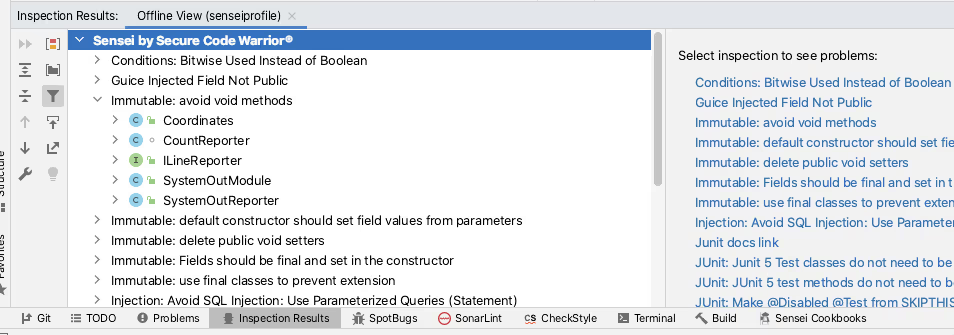
This is officially documented on the JetBrains site:
- https://www.jetbrains.com/help/idea/command-line-code-inspector.html#inspection-results
This might be used during a code review process if the command line execution was incorporated into a Continuous Integration process and the reviewers wanted to check the full source context of any of the Inspection result entries.
Inspection Profiles in Continuous Integration
When adding the Command Line inspection into Continuous Integration we ideally want a report to be generated automatically and there are a number of options open to us.
TeamCity offers out of the box support for Inspection Profiles in Continuous Integration.
- https://www.jetbrains.com/help/teamcity/inspections.html
The Jenkins Warnings NG plugin supports the Command Line output from IntelliJ Inspections as one of the report formats.
- https://github.com/jenkinsci/warnings-ng-plugin
- https://github.com/jenkinsci/warnings-ng-plugin/blob/master/SUPPORTED-FORMATS.md
Community projects like `idea CLI Inspector` exist to support using Inspection Profiles in other CI tooling i.e.
- https://github.com/bentolor/idea-cli-inspector
The future of Inspection Profiles in a CI process looks even brighter with the introduction of the JetBrains Qodana project. The Qodana project is a headless version of IntelliJ with official Github Actions and Docker images.
- https://github.com/JetBrains/Qodana
Qodana is currently in beta, but the Sensei team is monitoring it so that it becomes an officially supported platform for running Sensei rules as part of Continuous Integration.
Summary
Intention Actions allow us to reinforce coding patterns and quickly fix them in the IDE when we make mistakes during coding.
Inspection Profiles allow us to collect these into profiles which can run in batch as an Analyze and Inspect Code action. This can be useful if we encounter a pattern and want to double-check if we have missed that anywhere else in our code.
Inspection Profiles can be run from the command line and even incorporated into Continuous Integration processes supporting a “trust, but verify” model and catch any accidental slippage.
All of the above is built in IntelliJ functionality and JetBrains are improving their Continuous Integration process with the introduction of Qodana.
Sensei recipes are loaded into IntelliJ to act as native Intention Actions and be collected into Inspection Profiles to support batch checking through Inspect Code and Continuous Integration support provided by the official JetBrains Command Line execution functionality.
---
You can install Sensei from within IntelliJ using "Preferences \ Plugins" (Mac) or "Settings \ Plugins" (Windows) then just search for “sensei secure code”.
If you want to try running a project in IntelliJ from the command line then the project used in this post can be found in the `sensei-blog-examples` repository in the Secure Code Warrior GitHub account. An exercise to the reader is to create a profile that will run just the Sensei rules. Give it a try:
https://github.com/securecodewarrior/sensei-blog-examples


Learn how to run Sensei and IntelliJ Intention Actions in batch mode as Inspections within the IDE, from the Command-Line, and in Continuous Integration.
Alan Richardson has more than twenty years of professional IT experience, working as a developer and at every level of the testing hierarchy from Tester through to Head of Testing. Head of Developer Relations at Secure Code Warrior, he works directly with teams, to improve the development of quality secure code. Alan is the author of four books including “Dear Evil Tester”, and “Java For Testers”. Alan has also created online training courses to help people learn Technical Web Testing and Selenium WebDriver with Java. Alan posts his writing and training videos on SeleniumSimplified.com, EvilTester.com, JavaForTesters.com, and CompendiumDev.co.uk.
Secure Code Warrior is here for your organization to help you secure code across the entire software development lifecycle and create a culture in which cybersecurity is top of mind. Whether you’re an AppSec Manager, Developer, CISO, or anyone involved in security, we can help your organization reduce risks associated with insecure code.
Book a demoAlan Richardson has more than twenty years of professional IT experience, working as a developer and at every level of the testing hierarchy from Tester through to Head of Testing. Head of Developer Relations at Secure Code Warrior, he works directly with teams, to improve the development of quality secure code. Alan is the author of four books including “Dear Evil Tester”, and “Java For Testers”. Alan has also created online training courses to help people learn Technical Web Testing and Selenium WebDriver with Java. Alan posts his writing and training videos on SeleniumSimplified.com, EvilTester.com, JavaForTesters.com, and CompendiumDev.co.uk.


Running IntelliJ Inspections From Continuous Integration
IntelliJ IDEA offers functionality to help improve our coding, within the IDE when writing code as Intentions. Intentions can be used in batch to inspect code for patterns throughout the source and even extending to Command-Line analysis or added to Continuous Integration. This post covers the out of the box IntelliJ functionality and expanding with custom Intentions created in Sensei.
IntelliJ Inspections
The Inspections feature of IntelliJ drives the display of many of the errors that are reported dynamically in the IDE when coding e.g.
- detecting abstract classes that can be converted to interfaces,
- identifying redundant class fields which can be local,
- warning about uses of deprecated methods,
- etc.
These Inspections highlight code that matches in the IDE as Intention Actions which often have an associated QuickFix.

The real-time IDE highlighting when code matches an Inspection can help us improve our coding dynamically. After identifying the issue in the code, using IntelliJ Intention Actions to QuickFix the code can reinforce better patterns.
Inspections Profile
Inspections can run as a batch from within the IDE, and from the Command Line or in a Continuous Integration process.
The key to working with IntelliJ inspections as a batch is through the use of an Inspections Profile.
IntelliJ has two default Inspection Profiles: one stored in the Project, and one stored in the IDE.
New Inspection Profiles can be created to configure specific plugins or use-cases e.g.
- Run Checkstyle real-time scan only
- Run a specific set of Sensei rules
- Run the HTML checks
The Inspections in a profile can be enabled or disabled from the IntelliJ Preferences. The Preferences dialog is also an easy way to learn the range of Inspections available.

The ‘tool’ icon allows you to duplicate a Profile and create a new Profile to collect a specific set of rules.

Running an Inspection Profile in the IDE
Inspection Profiles can be run from within the IDE using the `Analyze \ Inspect Code...` menu.

The Analyze functionality allows you to control the scope that the Inspection will run against e.g. the whole project, including or excluding test sources, or against a specific set of files.

You can also manage the Inspection Profiles from here to create or configure a particular profile.
Clicking [OK] on the “Specify Inspection Scope” dialog will trigger IntelliJ into running all the selected Inspections in the profile across the defined scope.
IntelliJ will report the results of running the Inspections in the `Inspection Results` tab.

The Sensei plugin from Secure Code Warrior allows you to create custom code matching recipes. Sensei tightly integrates with IntelliJ to make these custom recipes as natural to use as the IntelliJ Intention Actions. Meaning they are loaded into IntelliJ as Inspections and can be grouped, enabled, and disabled using Inspection Profiles. Creating a custom Inspection Profile and then using the Analyze Inspect Code functionality is the recommended way of running Sensei recipes in bulk across a project.
Running an Inspection Profile from the Command Line
IntelliJ has the ability to run inspections from the command line as documented by JetBrains:
- https://www.jetbrains.com/help/idea/working-with-the-ide-features-from-command-line.html
I primarily use macOS, and can run a single instance of IntelliJ from the command line with:
open -na "IntelliJ IDEA CE.app"
To support easier execution I add this to a shell command script.
vi /usr/local/bin/idea
The contents of the script are from the official documentation provided by IntelliJ.
#!/bin/sh
open -na "IntelliJ IDEA CE.app" --args "$@"
I then made this executable to allow me to simplify the command line inspection process.
chmod 755 /usr/local/bin/idea
The official intellij docs describe the general form of the inspection command as:
idea inspect <project> <inspection-profile> <output></output></inspection-profile></project>
[<options>]</options>
In practice, I fully qualify the paths and don’t need any options:
idea inspect /Users/user/GitHub/sensei-blog-examples /Users/user/GitHub/sensei-blog-examples/.idea/inspectionProfiles/senseiprofile.xml /Users/user/GitHub/sensei-blog-examples/scan-results
This runs all the Inspections I added to the `senseiprofile` and reports the results in the `scan-results` folder.

Viewing Inspection Results
We can report these results from within Continuous Integration, as we’ll see later.
We can also view them within IntelliJ itself using the `Analyse \ View Offline Inspection Results…` feature.

This will load the results into the `Inspection Results` tab.

This is officially documented on the JetBrains site:
- https://www.jetbrains.com/help/idea/command-line-code-inspector.html#inspection-results
This might be used during a code review process if the command line execution was incorporated into a Continuous Integration process and the reviewers wanted to check the full source context of any of the Inspection result entries.
Inspection Profiles in Continuous Integration
When adding the Command Line inspection into Continuous Integration we ideally want a report to be generated automatically and there are a number of options open to us.
TeamCity offers out of the box support for Inspection Profiles in Continuous Integration.
- https://www.jetbrains.com/help/teamcity/inspections.html
The Jenkins Warnings NG plugin supports the Command Line output from IntelliJ Inspections as one of the report formats.
- https://github.com/jenkinsci/warnings-ng-plugin
- https://github.com/jenkinsci/warnings-ng-plugin/blob/master/SUPPORTED-FORMATS.md
Community projects like `idea CLI Inspector` exist to support using Inspection Profiles in other CI tooling i.e.
- https://github.com/bentolor/idea-cli-inspector
The future of Inspection Profiles in a CI process looks even brighter with the introduction of the JetBrains Qodana project. The Qodana project is a headless version of IntelliJ with official Github Actions and Docker images.
- https://github.com/JetBrains/Qodana
Qodana is currently in beta, but the Sensei team is monitoring it so that it becomes an officially supported platform for running Sensei rules as part of Continuous Integration.
Summary
Intention Actions allow us to reinforce coding patterns and quickly fix them in the IDE when we make mistakes during coding.
Inspection Profiles allow us to collect these into profiles which can run in batch as an Analyze and Inspect Code action. This can be useful if we encounter a pattern and want to double-check if we have missed that anywhere else in our code.
Inspection Profiles can be run from the command line and even incorporated into Continuous Integration processes supporting a “trust, but verify” model and catch any accidental slippage.
All of the above is built in IntelliJ functionality and JetBrains are improving their Continuous Integration process with the introduction of Qodana.
Sensei recipes are loaded into IntelliJ to act as native Intention Actions and be collected into Inspection Profiles to support batch checking through Inspect Code and Continuous Integration support provided by the official JetBrains Command Line execution functionality.
---
You can install Sensei from within IntelliJ using "Preferences \ Plugins" (Mac) or "Settings \ Plugins" (Windows) then just search for “sensei secure code”.
If you want to try running a project in IntelliJ from the command line then the project used in this post can be found in the `sensei-blog-examples` repository in the Secure Code Warrior GitHub account. An exercise to the reader is to create a profile that will run just the Sensei rules. Give it a try:
https://github.com/securecodewarrior/sensei-blog-examples

Running IntelliJ Inspections From Continuous Integration
IntelliJ IDEA offers functionality to help improve our coding, within the IDE when writing code as Intentions. Intentions can be used in batch to inspect code for patterns throughout the source and even extending to Command-Line analysis or added to Continuous Integration. This post covers the out of the box IntelliJ functionality and expanding with custom Intentions created in Sensei.
IntelliJ Inspections
The Inspections feature of IntelliJ drives the display of many of the errors that are reported dynamically in the IDE when coding e.g.
- detecting abstract classes that can be converted to interfaces,
- identifying redundant class fields which can be local,
- warning about uses of deprecated methods,
- etc.
These Inspections highlight code that matches in the IDE as Intention Actions which often have an associated QuickFix.

The real-time IDE highlighting when code matches an Inspection can help us improve our coding dynamically. After identifying the issue in the code, using IntelliJ Intention Actions to QuickFix the code can reinforce better patterns.
Inspections Profile
Inspections can run as a batch from within the IDE, and from the Command Line or in a Continuous Integration process.
The key to working with IntelliJ inspections as a batch is through the use of an Inspections Profile.
IntelliJ has two default Inspection Profiles: one stored in the Project, and one stored in the IDE.
New Inspection Profiles can be created to configure specific plugins or use-cases e.g.
- Run Checkstyle real-time scan only
- Run a specific set of Sensei rules
- Run the HTML checks
The Inspections in a profile can be enabled or disabled from the IntelliJ Preferences. The Preferences dialog is also an easy way to learn the range of Inspections available.

The ‘tool’ icon allows you to duplicate a Profile and create a new Profile to collect a specific set of rules.

Running an Inspection Profile in the IDE
Inspection Profiles can be run from within the IDE using the `Analyze \ Inspect Code...` menu.

The Analyze functionality allows you to control the scope that the Inspection will run against e.g. the whole project, including or excluding test sources, or against a specific set of files.

You can also manage the Inspection Profiles from here to create or configure a particular profile.
Clicking [OK] on the “Specify Inspection Scope” dialog will trigger IntelliJ into running all the selected Inspections in the profile across the defined scope.
IntelliJ will report the results of running the Inspections in the `Inspection Results` tab.

The Sensei plugin from Secure Code Warrior allows you to create custom code matching recipes. Sensei tightly integrates with IntelliJ to make these custom recipes as natural to use as the IntelliJ Intention Actions. Meaning they are loaded into IntelliJ as Inspections and can be grouped, enabled, and disabled using Inspection Profiles. Creating a custom Inspection Profile and then using the Analyze Inspect Code functionality is the recommended way of running Sensei recipes in bulk across a project.
Running an Inspection Profile from the Command Line
IntelliJ has the ability to run inspections from the command line as documented by JetBrains:
- https://www.jetbrains.com/help/idea/working-with-the-ide-features-from-command-line.html
I primarily use macOS, and can run a single instance of IntelliJ from the command line with:
open -na "IntelliJ IDEA CE.app"
To support easier execution I add this to a shell command script.
vi /usr/local/bin/idea
The contents of the script are from the official documentation provided by IntelliJ.
#!/bin/sh
open -na "IntelliJ IDEA CE.app" --args "$@"
I then made this executable to allow me to simplify the command line inspection process.
chmod 755 /usr/local/bin/idea
The official intellij docs describe the general form of the inspection command as:
idea inspect <project> <inspection-profile> <output></output></inspection-profile></project>
[<options>]</options>
In practice, I fully qualify the paths and don’t need any options:
idea inspect /Users/user/GitHub/sensei-blog-examples /Users/user/GitHub/sensei-blog-examples/.idea/inspectionProfiles/senseiprofile.xml /Users/user/GitHub/sensei-blog-examples/scan-results
This runs all the Inspections I added to the `senseiprofile` and reports the results in the `scan-results` folder.

Viewing Inspection Results
We can report these results from within Continuous Integration, as we’ll see later.
We can also view them within IntelliJ itself using the `Analyse \ View Offline Inspection Results…` feature.

This will load the results into the `Inspection Results` tab.

This is officially documented on the JetBrains site:
- https://www.jetbrains.com/help/idea/command-line-code-inspector.html#inspection-results
This might be used during a code review process if the command line execution was incorporated into a Continuous Integration process and the reviewers wanted to check the full source context of any of the Inspection result entries.
Inspection Profiles in Continuous Integration
When adding the Command Line inspection into Continuous Integration we ideally want a report to be generated automatically and there are a number of options open to us.
TeamCity offers out of the box support for Inspection Profiles in Continuous Integration.
- https://www.jetbrains.com/help/teamcity/inspections.html
The Jenkins Warnings NG plugin supports the Command Line output from IntelliJ Inspections as one of the report formats.
- https://github.com/jenkinsci/warnings-ng-plugin
- https://github.com/jenkinsci/warnings-ng-plugin/blob/master/SUPPORTED-FORMATS.md
Community projects like `idea CLI Inspector` exist to support using Inspection Profiles in other CI tooling i.e.
- https://github.com/bentolor/idea-cli-inspector
The future of Inspection Profiles in a CI process looks even brighter with the introduction of the JetBrains Qodana project. The Qodana project is a headless version of IntelliJ with official Github Actions and Docker images.
- https://github.com/JetBrains/Qodana
Qodana is currently in beta, but the Sensei team is monitoring it so that it becomes an officially supported platform for running Sensei rules as part of Continuous Integration.
Summary
Intention Actions allow us to reinforce coding patterns and quickly fix them in the IDE when we make mistakes during coding.
Inspection Profiles allow us to collect these into profiles which can run in batch as an Analyze and Inspect Code action. This can be useful if we encounter a pattern and want to double-check if we have missed that anywhere else in our code.
Inspection Profiles can be run from the command line and even incorporated into Continuous Integration processes supporting a “trust, but verify” model and catch any accidental slippage.
All of the above is built in IntelliJ functionality and JetBrains are improving their Continuous Integration process with the introduction of Qodana.
Sensei recipes are loaded into IntelliJ to act as native Intention Actions and be collected into Inspection Profiles to support batch checking through Inspect Code and Continuous Integration support provided by the official JetBrains Command Line execution functionality.
---
You can install Sensei from within IntelliJ using "Preferences \ Plugins" (Mac) or "Settings \ Plugins" (Windows) then just search for “sensei secure code”.
If you want to try running a project in IntelliJ from the command line then the project used in this post can be found in the `sensei-blog-examples` repository in the Secure Code Warrior GitHub account. An exercise to the reader is to create a profile that will run just the Sensei rules. Give it a try:
https://github.com/securecodewarrior/sensei-blog-examples

Click on the link below and download the PDF of this resource.
Secure Code Warrior is here for your organization to help you secure code across the entire software development lifecycle and create a culture in which cybersecurity is top of mind. Whether you’re an AppSec Manager, Developer, CISO, or anyone involved in security, we can help your organization reduce risks associated with insecure code.
View reportBook a demoAlan Richardson has more than twenty years of professional IT experience, working as a developer and at every level of the testing hierarchy from Tester through to Head of Testing. Head of Developer Relations at Secure Code Warrior, he works directly with teams, to improve the development of quality secure code. Alan is the author of four books including “Dear Evil Tester”, and “Java For Testers”. Alan has also created online training courses to help people learn Technical Web Testing and Selenium WebDriver with Java. Alan posts his writing and training videos on SeleniumSimplified.com, EvilTester.com, JavaForTesters.com, and CompendiumDev.co.uk.
Running IntelliJ Inspections From Continuous Integration
IntelliJ IDEA offers functionality to help improve our coding, within the IDE when writing code as Intentions. Intentions can be used in batch to inspect code for patterns throughout the source and even extending to Command-Line analysis or added to Continuous Integration. This post covers the out of the box IntelliJ functionality and expanding with custom Intentions created in Sensei.
IntelliJ Inspections
The Inspections feature of IntelliJ drives the display of many of the errors that are reported dynamically in the IDE when coding e.g.
- detecting abstract classes that can be converted to interfaces,
- identifying redundant class fields which can be local,
- warning about uses of deprecated methods,
- etc.
These Inspections highlight code that matches in the IDE as Intention Actions which often have an associated QuickFix.

The real-time IDE highlighting when code matches an Inspection can help us improve our coding dynamically. After identifying the issue in the code, using IntelliJ Intention Actions to QuickFix the code can reinforce better patterns.
Inspections Profile
Inspections can run as a batch from within the IDE, and from the Command Line or in a Continuous Integration process.
The key to working with IntelliJ inspections as a batch is through the use of an Inspections Profile.
IntelliJ has two default Inspection Profiles: one stored in the Project, and one stored in the IDE.
New Inspection Profiles can be created to configure specific plugins or use-cases e.g.
- Run Checkstyle real-time scan only
- Run a specific set of Sensei rules
- Run the HTML checks
The Inspections in a profile can be enabled or disabled from the IntelliJ Preferences. The Preferences dialog is also an easy way to learn the range of Inspections available.

The ‘tool’ icon allows you to duplicate a Profile and create a new Profile to collect a specific set of rules.

Running an Inspection Profile in the IDE
Inspection Profiles can be run from within the IDE using the `Analyze \ Inspect Code...` menu.

The Analyze functionality allows you to control the scope that the Inspection will run against e.g. the whole project, including or excluding test sources, or against a specific set of files.

You can also manage the Inspection Profiles from here to create or configure a particular profile.
Clicking [OK] on the “Specify Inspection Scope” dialog will trigger IntelliJ into running all the selected Inspections in the profile across the defined scope.
IntelliJ will report the results of running the Inspections in the `Inspection Results` tab.

The Sensei plugin from Secure Code Warrior allows you to create custom code matching recipes. Sensei tightly integrates with IntelliJ to make these custom recipes as natural to use as the IntelliJ Intention Actions. Meaning they are loaded into IntelliJ as Inspections and can be grouped, enabled, and disabled using Inspection Profiles. Creating a custom Inspection Profile and then using the Analyze Inspect Code functionality is the recommended way of running Sensei recipes in bulk across a project.
Running an Inspection Profile from the Command Line
IntelliJ has the ability to run inspections from the command line as documented by JetBrains:
- https://www.jetbrains.com/help/idea/working-with-the-ide-features-from-command-line.html
I primarily use macOS, and can run a single instance of IntelliJ from the command line with:
open -na "IntelliJ IDEA CE.app"
To support easier execution I add this to a shell command script.
vi /usr/local/bin/idea
The contents of the script are from the official documentation provided by IntelliJ.
#!/bin/sh
open -na "IntelliJ IDEA CE.app" --args "$@"
I then made this executable to allow me to simplify the command line inspection process.
chmod 755 /usr/local/bin/idea
The official intellij docs describe the general form of the inspection command as:
idea inspect <project> <inspection-profile> <output></output></inspection-profile></project>
[<options>]</options>
In practice, I fully qualify the paths and don’t need any options:
idea inspect /Users/user/GitHub/sensei-blog-examples /Users/user/GitHub/sensei-blog-examples/.idea/inspectionProfiles/senseiprofile.xml /Users/user/GitHub/sensei-blog-examples/scan-results
This runs all the Inspections I added to the `senseiprofile` and reports the results in the `scan-results` folder.

Viewing Inspection Results
We can report these results from within Continuous Integration, as we’ll see later.
We can also view them within IntelliJ itself using the `Analyse \ View Offline Inspection Results…` feature.

This will load the results into the `Inspection Results` tab.

This is officially documented on the JetBrains site:
- https://www.jetbrains.com/help/idea/command-line-code-inspector.html#inspection-results
This might be used during a code review process if the command line execution was incorporated into a Continuous Integration process and the reviewers wanted to check the full source context of any of the Inspection result entries.
Inspection Profiles in Continuous Integration
When adding the Command Line inspection into Continuous Integration we ideally want a report to be generated automatically and there are a number of options open to us.
TeamCity offers out of the box support for Inspection Profiles in Continuous Integration.
- https://www.jetbrains.com/help/teamcity/inspections.html
The Jenkins Warnings NG plugin supports the Command Line output from IntelliJ Inspections as one of the report formats.
- https://github.com/jenkinsci/warnings-ng-plugin
- https://github.com/jenkinsci/warnings-ng-plugin/blob/master/SUPPORTED-FORMATS.md
Community projects like `idea CLI Inspector` exist to support using Inspection Profiles in other CI tooling i.e.
- https://github.com/bentolor/idea-cli-inspector
The future of Inspection Profiles in a CI process looks even brighter with the introduction of the JetBrains Qodana project. The Qodana project is a headless version of IntelliJ with official Github Actions and Docker images.
- https://github.com/JetBrains/Qodana
Qodana is currently in beta, but the Sensei team is monitoring it so that it becomes an officially supported platform for running Sensei rules as part of Continuous Integration.
Summary
Intention Actions allow us to reinforce coding patterns and quickly fix them in the IDE when we make mistakes during coding.
Inspection Profiles allow us to collect these into profiles which can run in batch as an Analyze and Inspect Code action. This can be useful if we encounter a pattern and want to double-check if we have missed that anywhere else in our code.
Inspection Profiles can be run from the command line and even incorporated into Continuous Integration processes supporting a “trust, but verify” model and catch any accidental slippage.
All of the above is built in IntelliJ functionality and JetBrains are improving their Continuous Integration process with the introduction of Qodana.
Sensei recipes are loaded into IntelliJ to act as native Intention Actions and be collected into Inspection Profiles to support batch checking through Inspect Code and Continuous Integration support provided by the official JetBrains Command Line execution functionality.
---
You can install Sensei from within IntelliJ using "Preferences \ Plugins" (Mac) or "Settings \ Plugins" (Windows) then just search for “sensei secure code”.
If you want to try running a project in IntelliJ from the command line then the project used in this post can be found in the `sensei-blog-examples` repository in the Secure Code Warrior GitHub account. An exercise to the reader is to create a profile that will run just the Sensei rules. Give it a try:
https://github.com/securecodewarrior/sensei-blog-examples
Table of contents
Alan Richardson has more than twenty years of professional IT experience, working as a developer and at every level of the testing hierarchy from Tester through to Head of Testing. Head of Developer Relations at Secure Code Warrior, he works directly with teams, to improve the development of quality secure code. Alan is the author of four books including “Dear Evil Tester”, and “Java For Testers”. Alan has also created online training courses to help people learn Technical Web Testing and Selenium WebDriver with Java. Alan posts his writing and training videos on SeleniumSimplified.com, EvilTester.com, JavaForTesters.com, and CompendiumDev.co.uk.

Secure Code Warrior is here for your organization to help you secure code across the entire software development lifecycle and create a culture in which cybersecurity is top of mind. Whether you’re an AppSec Manager, Developer, CISO, or anyone involved in security, we can help your organization reduce risks associated with insecure code.
Book a demoDownloadResources to get you started
Trust Agent:AI - Secure and scale AI-Drive development
AI is writing code. Who’s governing it? With up to 50% of AI-generated code containing security weaknesses, managing AI risk is critical. Discover how SCW's Trust Agent: AI provides the real-time visibility, proactive governance, and targeted upskilling needed to scale AI-driven development securely.
The Power of OpenText Application Security + Secure Code Warrior
OpenText Application Security and Secure Code Warrior combine vulnerability detection with AI Software Governance and developer capability. Together, they help organizations reduce risk, strengthen secure coding practices, and confidently adopt AI-driven development.
Secure Code Warrior corporate overview
Secure Code Warrior is an AI Software Governance platform designed to enable organizations to safely adopt AI-driven development by bridging the gap between development velocity and enterprise security. The platform addresses the "Visibility Gap," where security teams often lack insights into shadow AI coding tools and the origins of production code.
Secure code training topics & content
Our industry-leading content is always evolving to fit the ever changing software development landscape with your role in mind. Topics covering everything from AI to XQuery Injection, offered for a variety of roles from Architects and Engineers to Product Managers and QA. Get a sneak peek of what our content catalog has to offer by topic and role.
Resources to get you started
Observe and Secure the ADLC: A Four-Point Framework for CISOs and Development Teams Using AI
While development teams look to make the most of GenAI’s undeniable benefits, we’d like to propose a four-point foundational framework that will allow security leaders to deploy AI coding tools and agents with a higher, more relevant standard of security best practices. It details exactly what enterprises can do to ensure safe, secure code development right now, and as agentic AI becomes an even bigger factor in the future.


